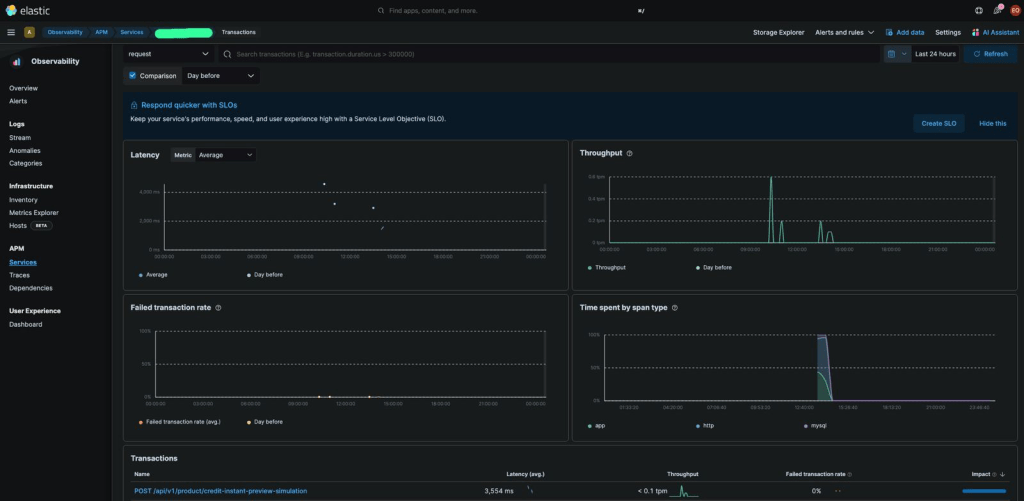
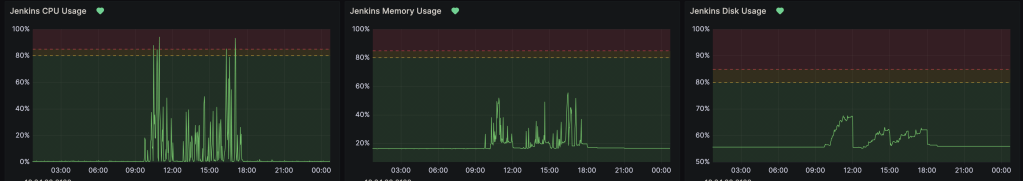
To ensure system reliability and improve incident response, I designed and implemented a comprehensive monitoring and observability stack using Prometheus and Grafana. I configured service-level metrics collection, custom alerts, and detailed dashboards to monitor everything from infrastructure health to application-level performance. T
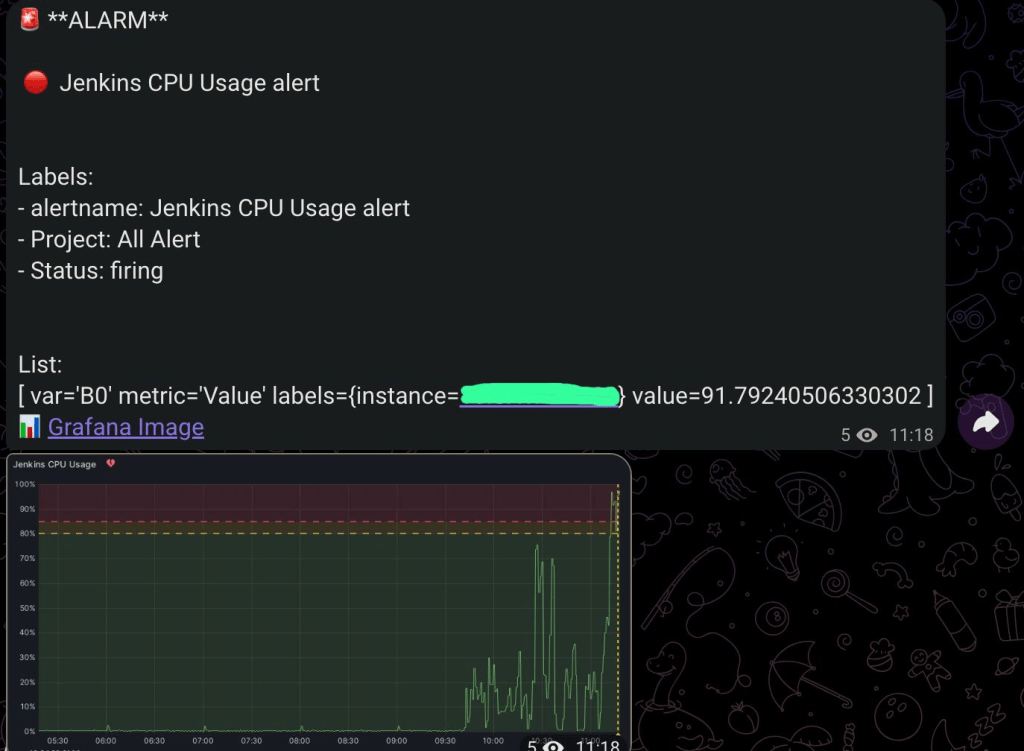
hese dashboards provide real-time insights on CPU/memory usage, container resource limits, API latency, request throughput, error rates, and more — empowering both DevOps and development teams to identify anomalies before they affect users. I also integrated alerting via Opsgenie and linked critical metrics to notification channels (e.g., Telegram) for faster collaboration and resolution.

This monitoring system plays a critical role in maintaining service uptime, debugging incidents, and validating SLAs in a production-grade environment.